WHAT WE OFFER
HousingWorks is the only Affordable Housing system providing these three interconnected services:
A Comprehensive Search and Apply Module collects unduplicated data on applicants from the moment they start applying anywhere to the moment their housing search ends.
A Centralized Inventory and Waitlist Module collects and reports on low-income housing inventory, while simplifying the updating and maintenance of waitlists.
Unique data sets are a byproduct of the comprehensive housing search module and the equally comprehensive waitlist services module providing real-time, supply-demand data that can help policy and planning agencies move effectively forward.
Since its inception in 2000, the HousingWorks team understood that it was essential to offer all three services simultaneously, through an ecosystem structure, where data is collected in the background of searching for and managing housing application/waitlist functions.
OUR LATEST REPORTS
The Affordable Housing Crisis in Massachusetts
Never before captured data shows that developments deemed “affordable” are no longer affordable for applicants, landlords, and even developers. Together, these reports show that the state’s Affordable Housing Plan may help the middle class but does not address the thousands of housing seekers already sitting on low-income waitlists.
Credits:
Data Conceptualization, Data Conclusions, Editing, Chart and Report Design
Thank you to:
Liz Hauck, John Kraft, Daniel J. Curley, Mat Thall, Michael Kane, Thuan Nguyen, and Dan Derman
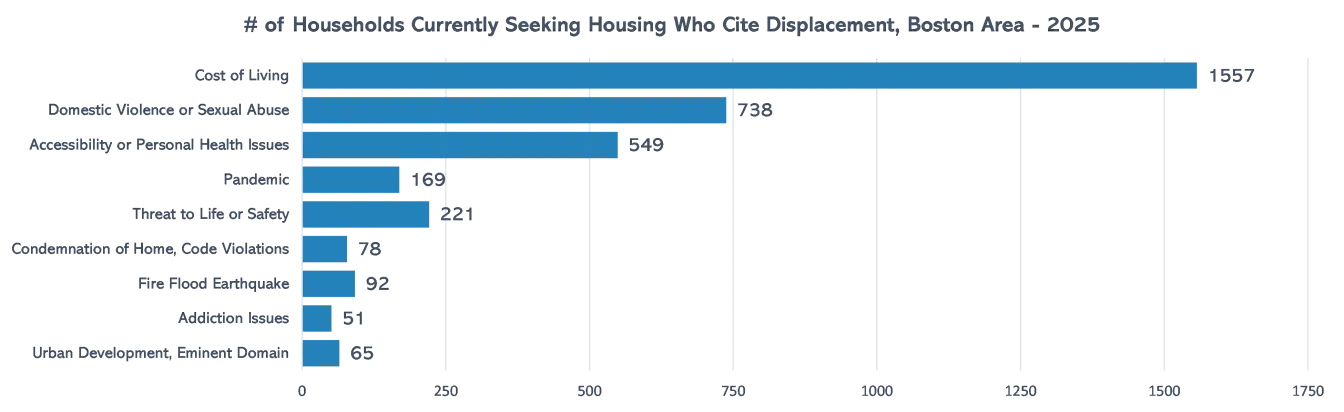
New data on displacement show that cost of living, domestic violence, and accessibility/health issues are the three biggest reasons for displacement.
- Displacement numbers are self-reported and show that nearly 25% of all low-income housing seekers are displaced.
- Cost of Living is the most commonly given reason for displacement, followed by Domestic Violence and the Pandemic – but these answers vary by sub-population.
- Displacement affects subpopulations in expected and unexpected ways.
- Displacement information is real-time, meaning the numbers you see are accurate as of Jan 7, 2022.
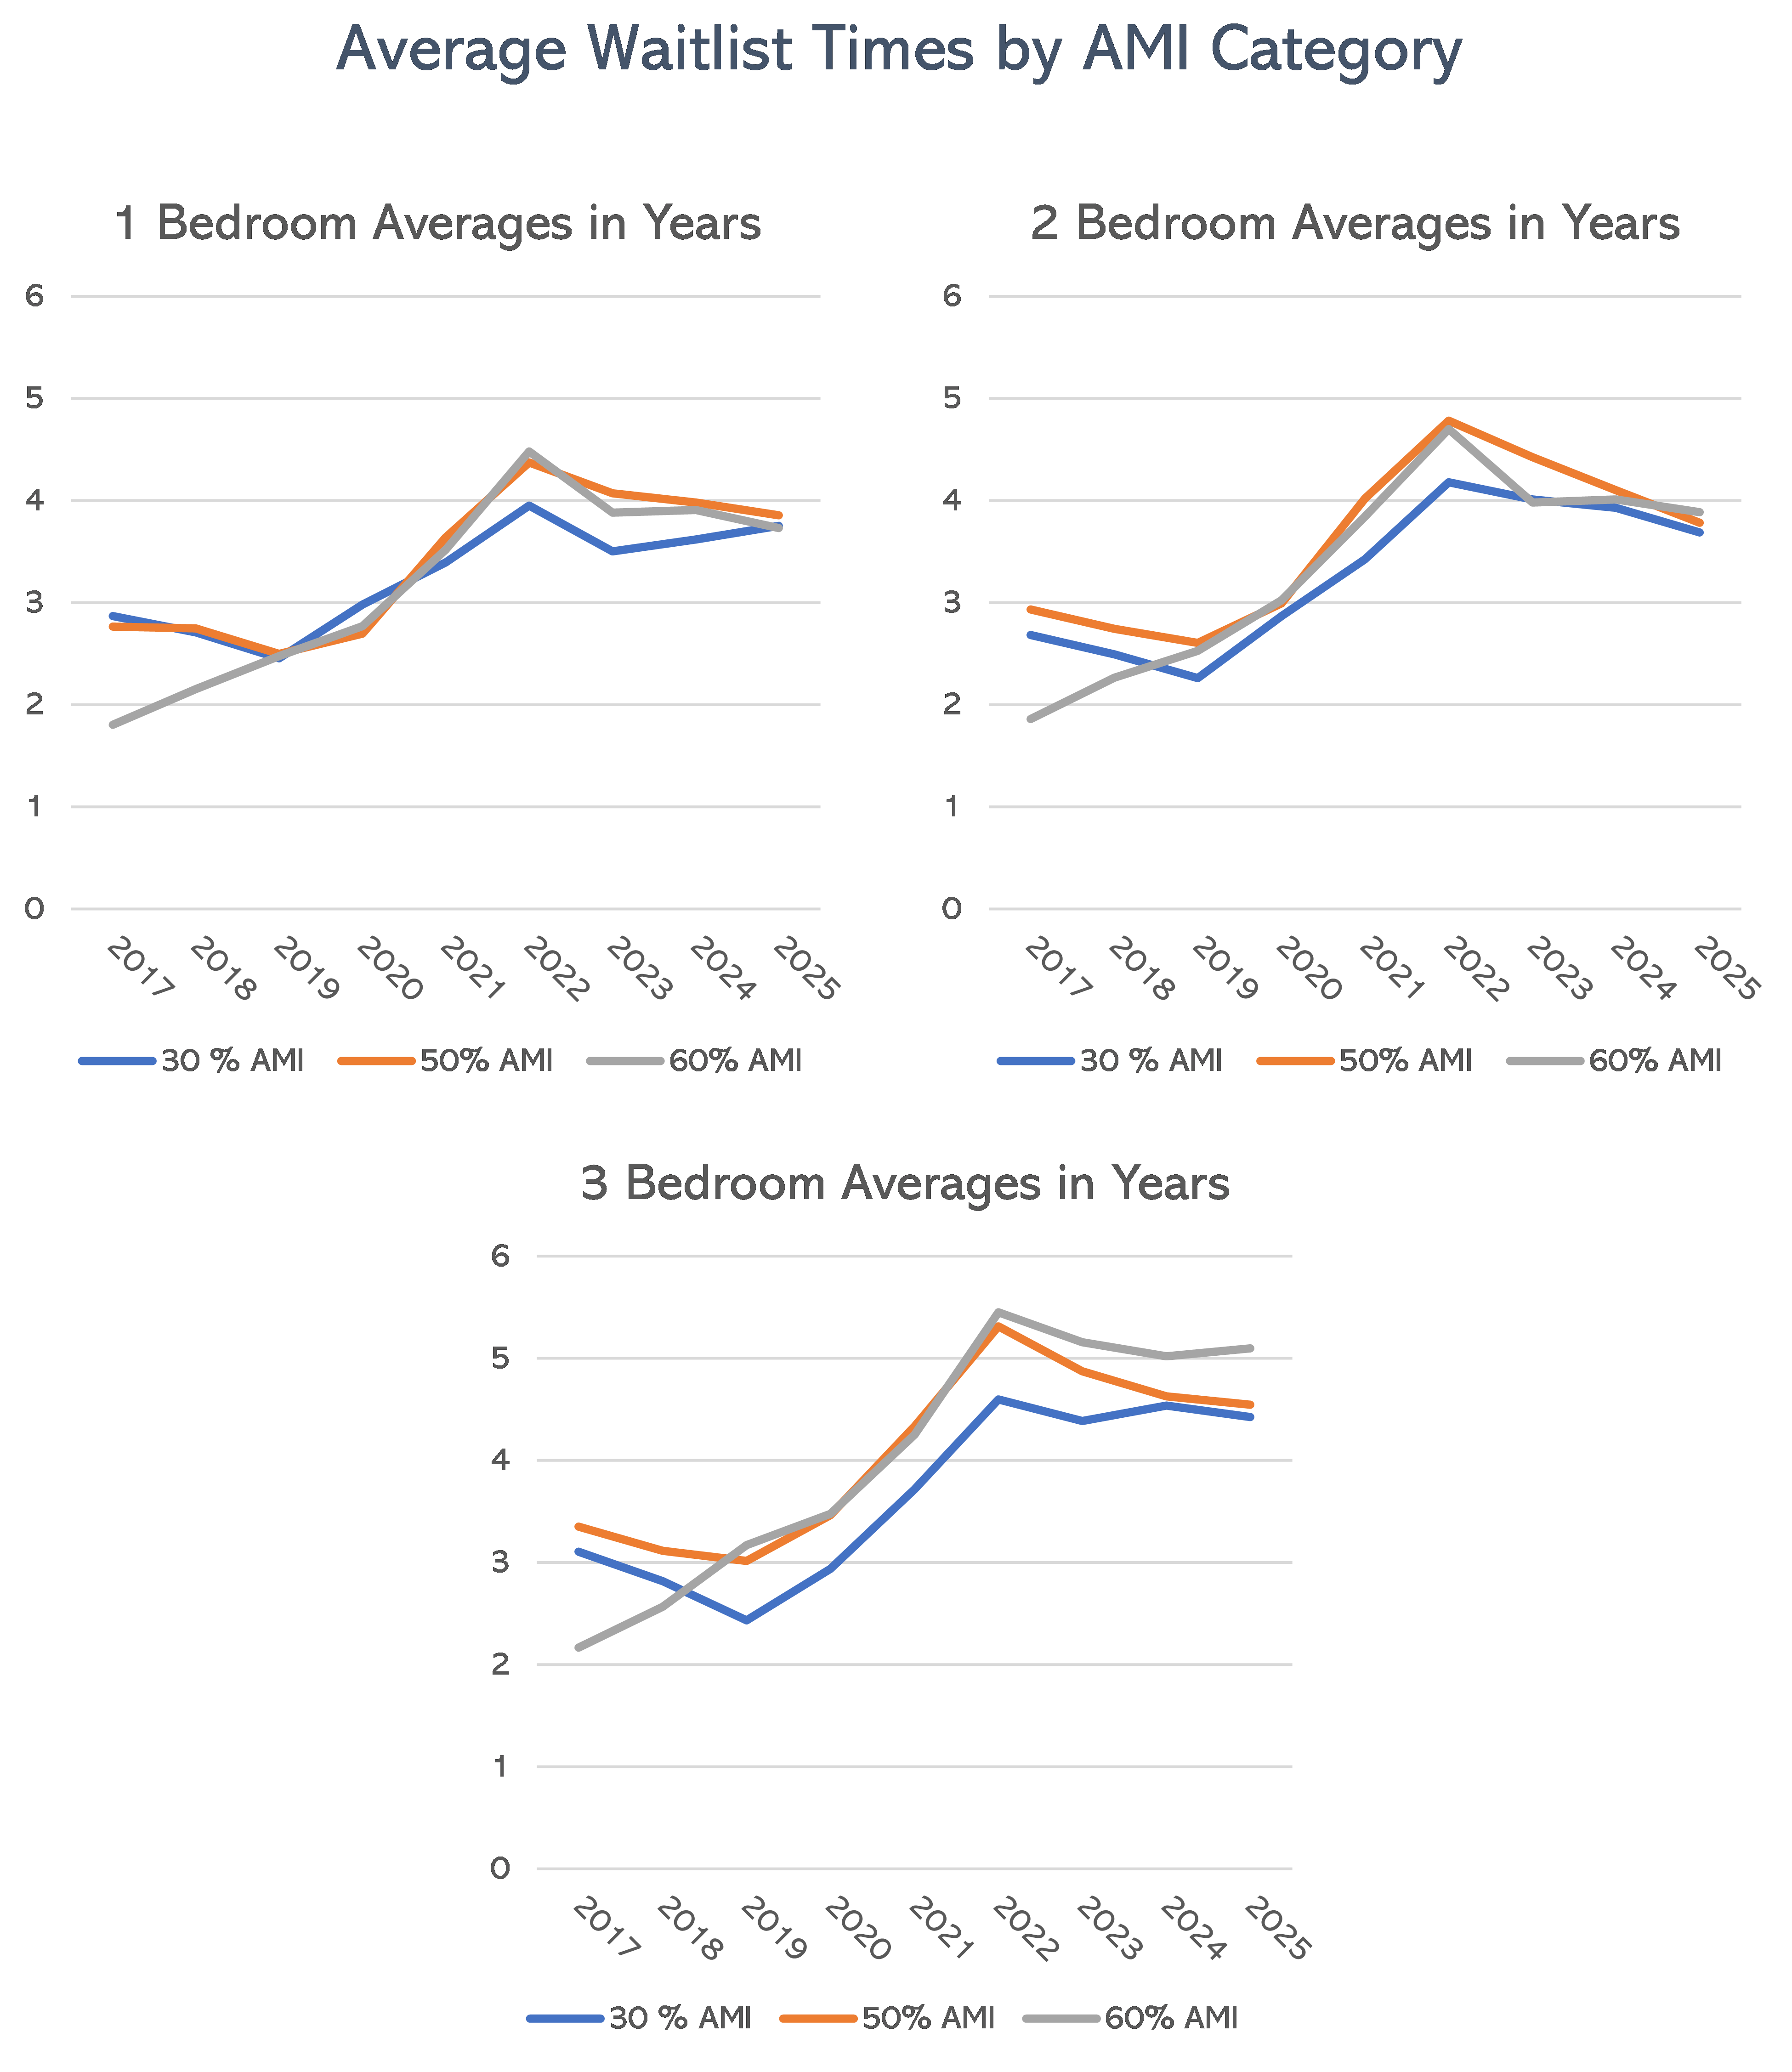
Waitlist times are increasing despite more and more “affordable” housing being built.
- Average waitlist times increased from pre-pandemic levels, indicating that what is being built is not actually affordable to low-income populations. Longest waitlist times have increased as well, now reaching over the 20-year mark.
- Reporting wait-times over a several-year period is more helpful than reporting only a single year, as certain events (e.g., opening a new waitlist) can have a major impact on a single year’s data while not shortening the actual waiting time.
- The meaning of “Affordable” changes quickly over time, so statements about “Affordability” need to always come with an explanation of what definition is being used.
- The “Waitlist Times” data shows that waitlist times are connected to income: Households with income above the 80% level do not have to wait anywhere near the same time for housing – what the data doesn’t show is that, while waiting, their circumstances are not as urgent. Whereas households below the 60% AMI level are forced to wait years for a housing opportunity and generally have other serious issues that eliminate their social capital. This suggests that current definitions of “Affordable Housing” may be missing an important variable: unreasonable waitlist times.
- The connection between worst waitlist times and displaced housing applicants needs further exploration. Why do some households need/choose to wait two decades or more for a housing opportunity?
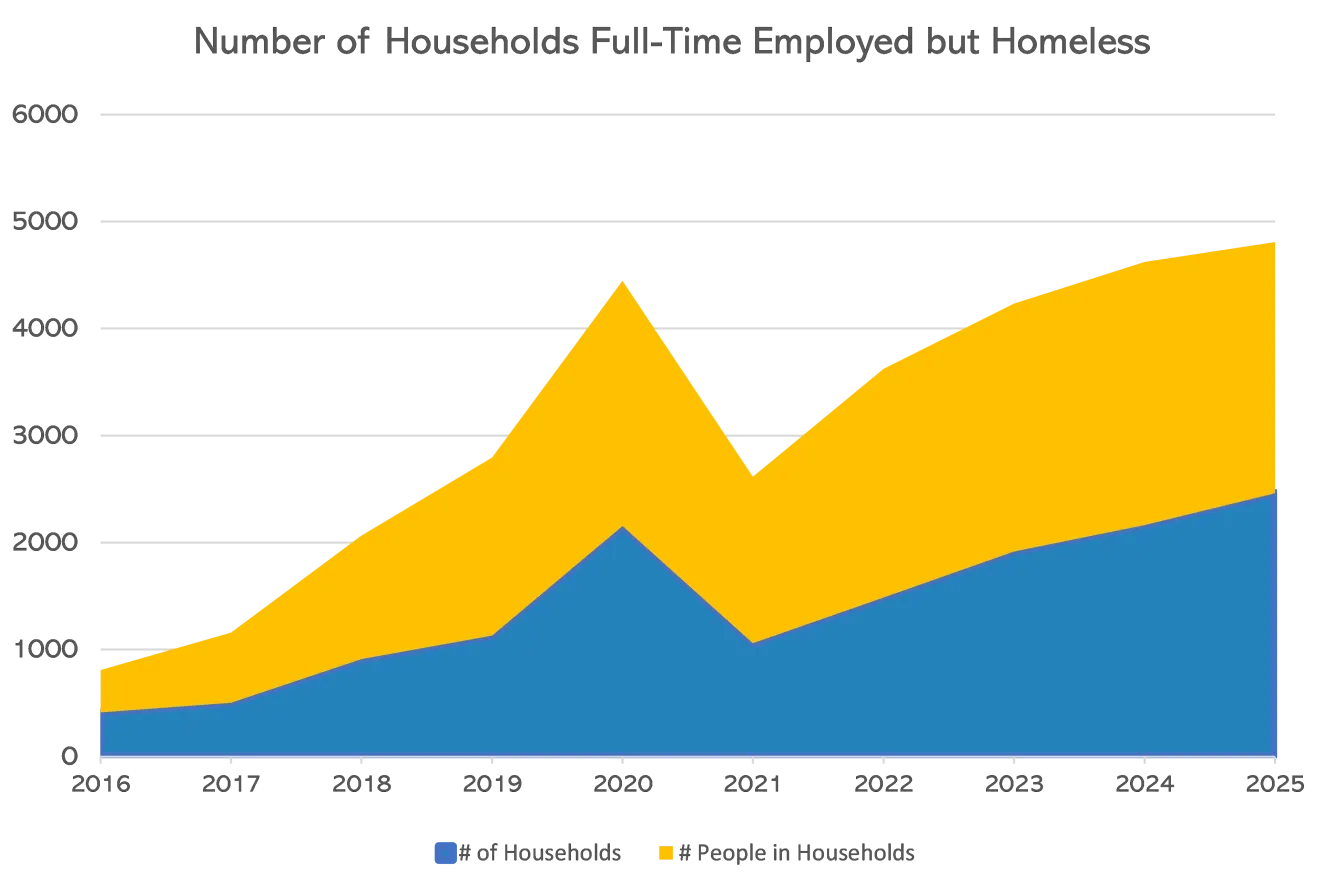
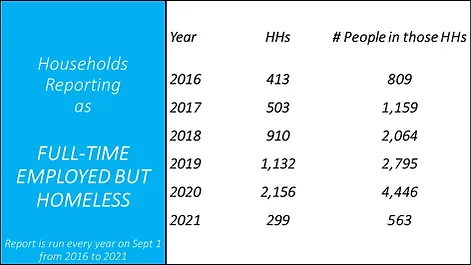
Numbers of Employed but Homeless Continue to Grow
- Families are self-reporting their housing status, so are using real-world definitions for “homeless” rather than accepting the government definition.
- For instance, someone illegally sleeping on a couch in a subsidized unit who is at risk of being asked to leave/evicted at any time might consider themselves homeless, even though the government would not. *
- Numbers of homeless but fully employed housing seekers were clearly increasing in the years before the pandemic, which suggests that housing policies were not successfully reversing the trend.
- These numbers lowered during the pandemic; likely in response to assistance money provided to both tenants and properties.
- Numbers are again on the rise, post-pandemic.
Sept 1, 2019 ~ For 19,000 + households applying in the Boston/Cambridge area
Dec 31, 2022 ~ For 20,000 + households applying to the same portfolio of properties in the Boston/Cambridge area
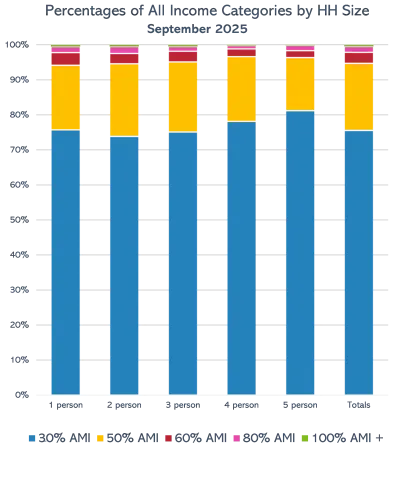
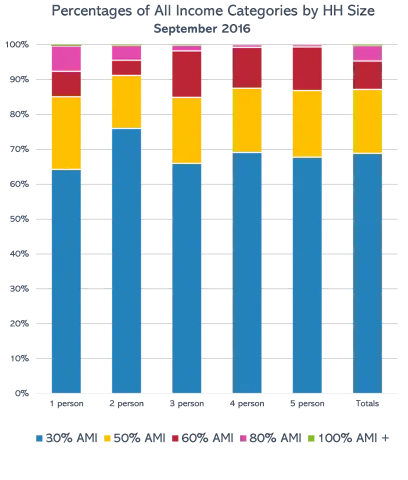
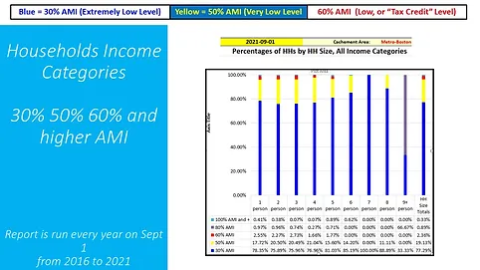
Income Levels Show That Crises Rapidly Change Applicant Eligibility and the Meaning of “Affordable”
- Since the company’s inception, most applicants (85-90%) applying via HousingWorks.net have fallen under the 60% AMI range. During the pandemic, that number rose to approximately 98%, with applicants who fall under the 60% AMI range disappearing almost completely.
- The disappearance of the 60% AMI population means two things: Longer waitlist times due to more people competing for 30% AMI units, and 60% units sitting empty since landlords have less and less eligible applicants for those units.
- Developments that include mostly 70% AMI units and higher, while often referred to as “income restricted,” are also included in discussions of “affordable housing.” But how can it be termed affordable if it automatically excludes most of the working population?
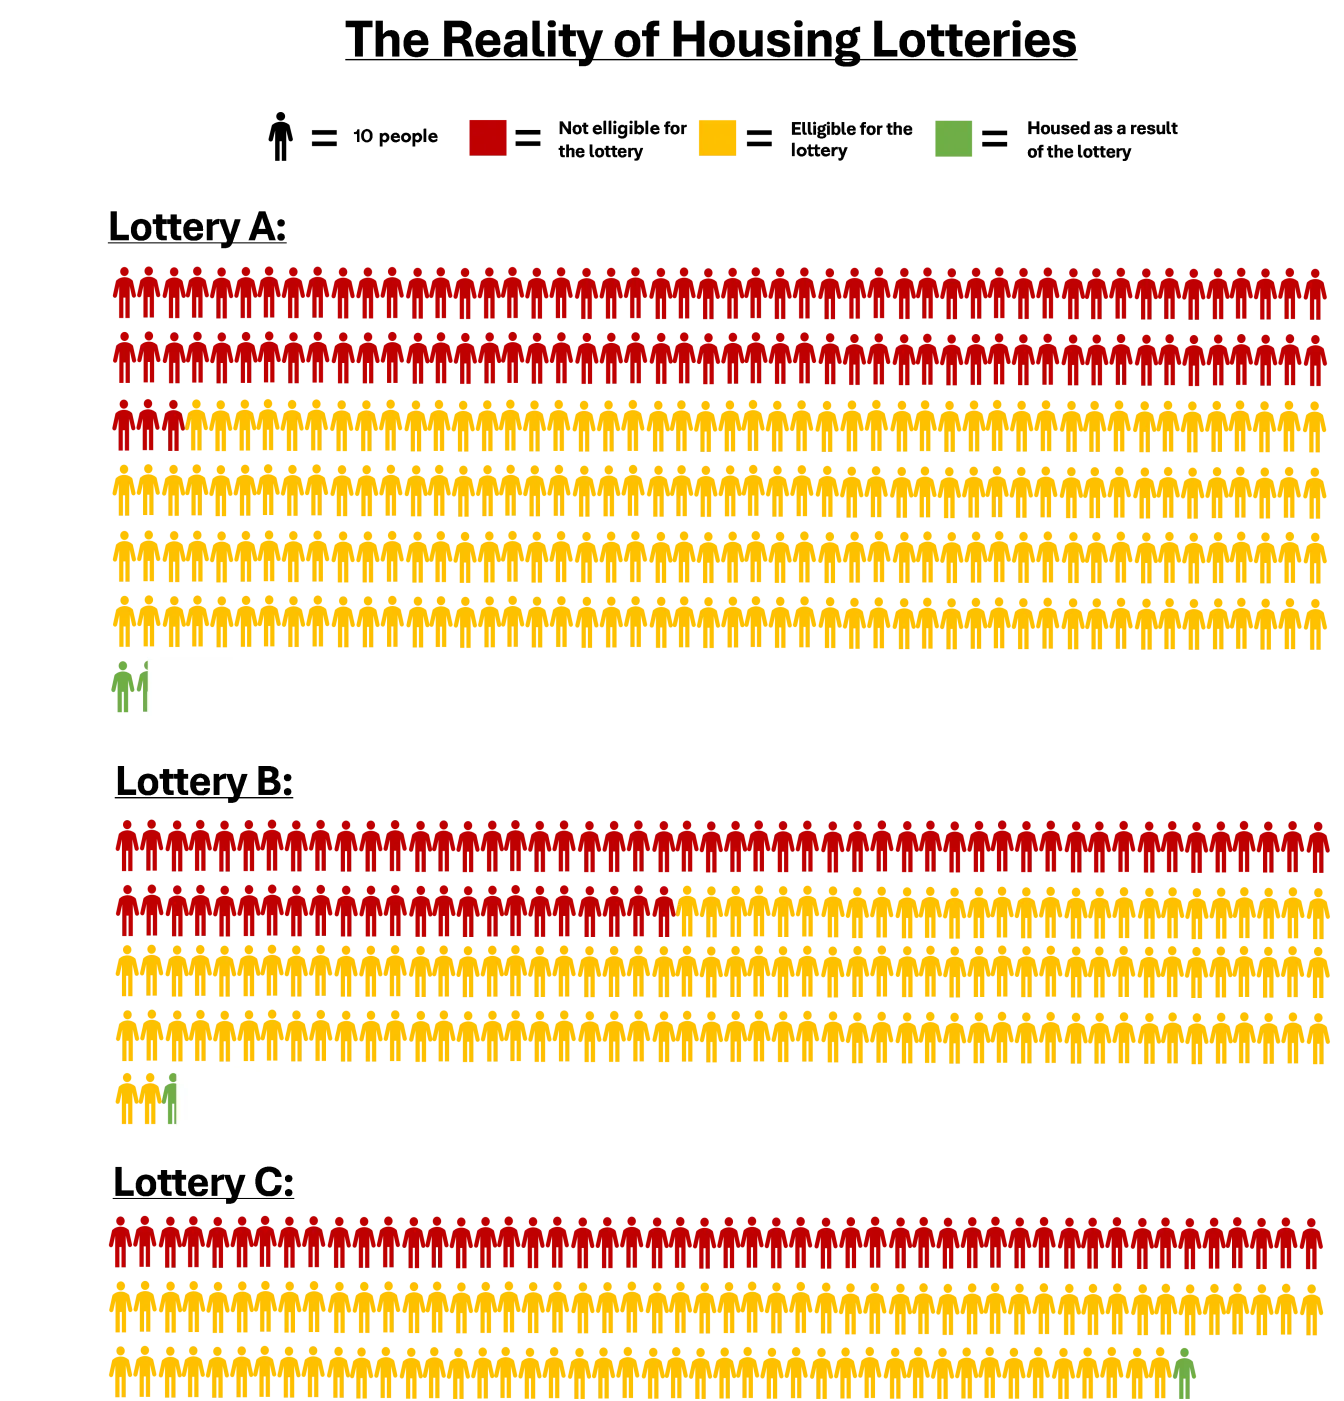
Housing Lotteries Show that 90% of applicants end up competing for the few lowest income level units made available in the lottery.
- Only a small percentage of eligible applicants who need affordable housing will find a solution in a lottery; the current housing doesn’t address the needs of those applying.
- Developers can’t afford to build properties that do address applicant need without additional government assistance or innovation.
- State and City affordable housing plans seem to benefit the middle class but fall short in addressing the thousands of housing seekers already sitting on low-income waitlists. This can be seen in wait times getting longer and the intense competition for very low-income units in Lotteries.
- The data raises important questions about how affordable housing is being underwritten.
HOUSINGWORKS IN ACTION
HousingWorks advocates for and supports implementation on new City of Boston initiative
The Boston Rental Subsidy Coalition comprised of 20 different advocacy groups, lobbied the mayor's office for 5 years to institute one of the first programs to convert so-called "affordable" housing into truly affordable housing. The mayor's answer was always no. However, the game changed when HousingWorks brought some of its data reports to city hall as a new member of the coalition.
HousingWorks offers guidance to Fenway CDC Data Policy Committee
"In 2020 Fenway CDC embarked on a strategic planning exercise to determine what income groups and populations we should be serving in future affordable housing developed by the organization. Our goal was to ground our values, vision and mission in solid information about where was the greatest need and demand for affordable housing in both the Fenway neighborhood and the entire City of Boston. The census was of very little help; waiting lists for existing Fenway CDC developments – not always up to date -- provided a bit more information. We were extremely fortunate, however, in having HousingWorks as part of the working group developing our policies and goals. The HousingWorks enormous database of over 20,000 families seeking affordable housing in Greater Boston was a treasure trove. And HousingWorks creative responses to our requests to manipulate, extract, sort their data helped us to present a detailed and nuanced policy recommendation to the entire Fenway CDC Board of Directors."
Mat Thall, Vice President, Fenway Community Development Corporation
HousingWorks helps property owners decide what to build next
2Life communities requested a report on average and worst waitlist times for each of their seven buildings which reside in Brighton, Newton, and Framingham, three very different socio-economic communities. They proactively sought this data to explore how to further their affordable housing mission.
HOW IT WORKS
The data provided by HousingWorks has helped numerous development companies plan and build new affordable housing units, The testimonial below helps further explain how.
"An important outcome of our work with HousingWorks has implications far beyond the development agenda of one Boston CDC. Many housing advocates have long been aware that much of the affordable housing that is being developed is not in fact affordable to a large number of applicants who do not have access to rental assistance. HousingWorks’ database makes it plain that the majority of individuals and families seeking affordable housing in Boston are Extremely Low Income…living in poverty. The majority of the affordable units being developed are not affordable to most of the applicants for affordable housing Fenway. CDC initially felt that it could address this issue internally by changing how rents in our future developments could be calculated. This proved to be impossible and has opened important questions about how affordable housing is being underwritten, whether rental assistance can be better integrated into new affordable housing and how new programs (such as the Boston Housing Authority City rent subsidy program) can address this serious shortcoming of the affordable housing sector."
Mat Thall, Vice President, Fenway Community Development Corporation
Additionally, HousingWorks advocates for and supports implementation on new City of Boston initiative.
The Boston Rental Subsidy Coalition comprised of 20 different advocacy groups, lobbied the mayor's office to institute one of the first programs to convert so-called "affordable" housing into truly affordable housing. The game changed when HousingWorks brought its data reports to city hall as a new member of the coalition that demonstrated the need and an approach to providing truly affordable housing in Boston.